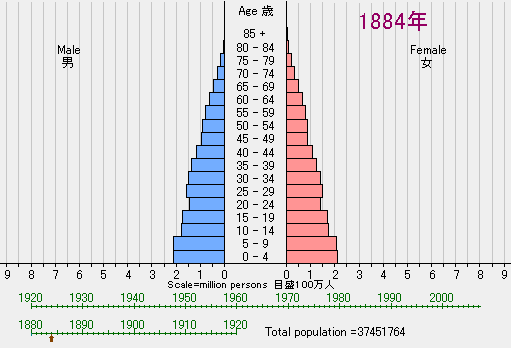
(Scale)Unit of scale is 'million persons'.
(Method of taking statistics)The statistics were taken from the civil registration before 1918, from the census result in census year after 1920 and estimation in other years. Attention is to be paid to the scope of Japan's area, people and time of statistics through about past 120 years.
[Source]"Historical Statistics of Japan", October 1987, Japan Statistical Association.@"Population Estimates of Japan", March 1970 and "Population Estimates Series No.36-" March1970-, Annual, Bureau of Statistics, Office of the Prime Minister. These sources are kept in Statistics Bureau of Japan.
[Remarks](a)Decline of young male from about 1937 is caused by their outgoing to external areas and war.(b)Temporary increases of births are seen in about 1948(first babyboom) and about 1973(second babyboom).(c)Tendency of decrease of births and increase of aged began in about 1975.